Showing posts with label St. Bonaventure. Show all posts

Monday, August 8, 2011

Dove Entrails & Tea Leaves -- Pythagoreas, Minutes and Points in the A-10

The Problem with Crystal Balls
As an expression (for the sake of clarety...), the process of determining how a team will do in the next season looks something like this...


How Team A will do this season = How Team A did last season - Team A players lost + Team A players gained + Team A intangibles


The Pythagorean Winning Percentage provides one of the best measures of how a team did in previous seasons. We can use a deductive approach to analyzing how the departed players will affect the next squad by looking at who is coming back, and what they bring. Incorporating new players into the mix is about the toughest part of the process...next to accurately assessing the impact of the intangibles of course. Taking a look at the first two elements (how Team A did and who Team A will bring back) is the start of the process, and once I have those two elements,it is easier to see how the last two could affect their performance and standing next season. Comparing each teams overall Pythagorean Winning Percentage (PWP) against the average of the conference (about 54.5, the Atlantic 10 is a very good conference), then doing the same for returning minutes (based on rosters through early August) and plotting the differences to a grid provides a clear indication of where each team sits compared to the rest of the conference. I have been partial to returning minutes because I think it provides a good sense of the relative maturity of different squads, but returning points has value, and so I decided to plot a second grid with points in place of minutes, as those who check out the second chart below. Can points tell us something that minutes might not? Compare Xavier's position in the tables below...


The X-axis returning percentage of minutes (above) and returning percentage of points (below). PWP is the Y-axis. For the PWP/Returning Minutes chart above, the axis intersect at (54.5,66.4), while for the PWP/Returning Points chart below, the intersection is (54.5,66.7).

.


A quick look and the two seem to virtually identical. A closer look uncovers a few differences worth exploring.

No Surprises Here
Temple and (sometimes) Xavier plot to the (upper left) above average quadrant for returning points and for the Musketeers, just below the average line for minutes returned (> average PWP, < average returning minutes), but the Muskies jump above the X-axis (average of returning scoring) in the second table -- a quick visual on the "value of Tu Holloway". For the past three seasons these two programs have turned the A-10 regular season into a duet. Those concerned about the X-men's minutes (ie experience) next season can relax, the program has learned to level the year-to-year ebb and flow of talent through the judicious application of red shirts and transfer eligibility rules. Coach Mack has Brad Releford, a rising junior sniper, Justin Martin, a red shirt (partial qualifier) freshman and Travis Taylor (transfer from Monmouth University) in reserve from last season, ready to step into the rotation for 2012. And even as I write, Isaiah Philmore, a transfer from Towson, will practice this season and be ready to step in 2013. Excellent programs can do that.

Coach Dunphy has not established that cushion for his Owl program, but every season a rotations/role player seems to step up and have a great year. Juan Fernandez and Ryan Brooks blossomed in 2010, while Scootie Randall and Khalif Wyatt did the same in 2011.

Testing Common Wisdom
Mature/experienced teams improve over their prior performances. That saw will be tested in 2012 as 2011 bottom-dwellers Fordham and Charlotte return squads that lost a combined 25 games in conference competition last season. Charlotte's fall from grace in 2011 (the 49ers returned higher-than-average minutes from a squad that posted a greater-than-average PWP from 2010) can be attributed to the education of rookie coach Alan Major. The transition from assistant to head coach, especially when a change of program is part of the transiton, can be bumpy -- Dayton fans take note. Coach Major brings in a large class rookie this season, which may be counter productive when installing new offensive/defensive systems. Coach Tom Pecora's Fordham squad showed improvement in his first season at Rose Hill, but the squad needs an infusion of A-10 level talent to establish momentum. Will he find them among the six new faces (freshmen) coming in for 2012?

For Saint Louis, Saint Joseph's, George Washington and St. Bonaventure however, the old saw may work out in 2012. Coach Mark Schmidt put the Bonnies on an upward trajectry when he took over in 2008. A-10 Player of the Year candidate Andrew Nicholson is a major reason, but Coach Schmidt has surrounded him with solid talent. Coach Mike Lonergan's hire last April places George Washington in a position similar to Charlotte's in 2011; a new coach taking charge of an experienced squad. Having seven years at the helm of Vermont gives Coach Lonergan an advantage the Major did not have however. Early season games against Syracuse, Georgia, UAB and Kansas State should give fans a good idea of where the program stands going into conference play. Coach Phil Martelli brought in a consensus conference-best class in 2011. Better yet, the class appears to be headed back to Hawk Hill for 2012 along with most of the eligible returnees, which ought to break Saint Joseph's two year run of 20 game losing seasons. Coach Rick Majerus' four year tenure at Saint Louis has been marked with a revolving door roster and a badly timed setback in 2011. 2012 should mark a substantial turnaround for the Billikens as they return nearly all of their (young) 2011 roster and suspended clutch guard Kwamain Mitchell. Should Coach Majerus' health hold up, the Billikens should have a hand in the conference race in 2012 and beyond.

When anticipating who would plot to the (lower left) "below average" on both factors quadrant, I thought the two last place teams, Charlotte and Fordham would be the strongest candidates. Both, it turns out, return more than average for minutes and points next season. The teams that did plot to the lower left quadrant are La Salle and Massachusetts, the teams that finished #9 and #10 respectively in 2011 conference play. The Explorers had a good balance of senior leadership and young talent, but was plagued with inconsistent play throughout the season. Some changes to the roster (especially when the freshman backcourt rotation -- Tyreek Duren, Sam Mills and Cole Stefan stay for another season) may benefit La Salle's prospects in 2012 (not to mention Dr. Giannini's job security).

For UMass however, the problem is inherent to the Dribble Drive Motion offensive system implemented by Coach Derek Kellogg. The DDM relies on a dynamic lead guard to either score via penetration or (when the situation calls for it...) get the ball to someone who can. The system needs reliable secondary scorers who can catch and and penetrate or shoot from the outside (when needed) and athletic front court players who can rebound and put back should the shooter's attempt miss. If the squad (especially that lead guard) not recognize and exploit/convert the scoring opportunities, the principal ball handler becomes a volume scorer. Since Gary Forbes' senior season (2008 -- Travis Ford's last as Coach in Amherst), Kellogg's lead guards (Ricky Harris and Anthony Gurley) typically take 30% or more of the possessions and shots, but the offense does not convert those possessions efficiently enough to win consistently. The problem in 2011 is that the scoring alternatives, Jesse Morgan and Freddie Riley had lower offensive (points per possession) ratings than Gurley. Those two and Chaz Williams, a 5-9 Hofstra transfer, will be next up as lead guard/scorer in the system.

Programs versus Teams
2012 should provide an opportunity to see which Coach Chris Mooney has built at Richmond during his tenure. The Spiders graduated a substantial percentage of their scoring and minutes over the past two seasons, but have a deep roster from which to draw. If the rotation players step forward (as Justing Harper did in 2011), the team should not take a large step back from their performance over the past two seasons. Can the same be said for Duquesne and Rhode Island, two other programs that played to the conference tournament quarter finals in 2011? The Runnin' Rams' Coach Jim Baron has had to scramble the past few off seasons to fill out his roster. Though he had early commitments, all too often they did not make it to campus, and the Rhode Island mentor had to rummage through JUCO lists and AAU rosters going late into July. This past season the needs were identified, those expected to return -- Akeem Richmond excepted -- will and the signees are all coming in as well. Those stitched together rosters produced three consecutive post season runs, but Coach Baron has never had so small a returning nucleus to start the season. Though transfers Billy Baron (the coach's son) and Andre Malone won't be available until after the fall semester, early season games at Texas and with regional rivals Boston College and Providence might provide a hing about Rhode Island's fortunes in 2012. Duquesne's Coach Ron Everhart has adjusted his gameplan to exploit the advantages a smaller, more mobile squad can provide. The frantic pace (#13 in D1 per Ken Pomeroy) caught unsuspecting teams off guard which, enabled the Dukes to earn a bye bid to the Atlantic 10 Conference Tournament and a post season spot in the CBI field in 2011. Coach Everhart will have a couple of taller players to replace Damian Saunders and Bill Clark, but will they be as efficient?

Caveat Emptor
Consider that...
1. The rosters are still taking shape. In the past week La Salle fans learned that South Carolina transfer Ramone Galloway was granted a waiver to play immediately (headline announcement on the front page of the team's web site), while (not publicly acknowledged...) rising sophomore Cole Stefan left the program and the school. Some schools (Rhode Island for example) tend to delay announcements on academic probation. And injuries can strain resources (see Xavier and Temple early in 2011) or derail a season (La Salle in 2010).
2. Fans may have their favorites for preseason Rookie of the Year, but predicting the impact of any freshman is tricky, involving both talent and opportunity...with a large helping of luck.
3. Of the last five new conference coaches, Xavier's Chris Mack (hard to believe he will enter his third year as a head coach in 2012) has had the easiest path -- credit the solid program he inherited when Sean Miller moved on to Arizona. What can the struggles of Tom Pecora, a successful veteran coach charged with rebuilding Fordham and Alan Major, an Ohio State Assistant Coach whose first bite at the head coaching apple came at Charlotte suggest to us about Archie Miller and Mike Lonergan's first season at Dayton and George Washington respectively? Miller takes over a light roster and has to find bodies just to cover the next season. Combined with his lack of head coaching experience the Flyers will most likely struggle to match 2011's 7-9 conference mark. Lonergan, an experienced hand at Vermont, steps into a deeper and stronger roster. How drastically he moves the squad to his offensive and defensive systems and how hard he pushes the current roster to get there will probably influence how enthusiastically the roster responds.

Friday, June 10, 2011

Wash, Rinse, Repeat -- The 2012 Atlantic-10 Conference Pairs

The Flip Side of 2011
Though at least one fan blog hinted at the pairings for the 2012 Atlantic-10 Conference regular season back on June 1, the conference did not officially release the pairings until June 6. Rather than build the conference mirror opponents and home/away games from scratch for 2012 (or roughly based on the 2011 conference results), the schedulemaker apparently decided to keep the 2011 mirror opponents and flip each team's 2011 home and away opponents for 2012 -- Saint Louis played Fordham, George Washington, Richmond, St. Bonaventure and Temple on the road in 2011, so they will host those teams at Chaifetz Arena in 2012. Was this a backhanded attempt at a balanced (over a two year period) schedule? For those interested in the complete listing, visit the Conference announcement here.

Fair and Balances?
I had noted last June when looking over the Atlantic-10 conference pairings that a balanced schedule may be only one of many objectives a conference schedulemaker may have satisfy...and a lower priority objective at that. Since the conference kept the same mirror opponents for 2012 as 2011 for each team, I decided to take the average of the conference Pythagorean Winning Percentage (PWP) for each team's mirros and compare them. Mirror games constitute 37.5% of each team's 16 game schedule. These pairings can provide a team with a big advantage (or a huge challange)...

Mirror Opponents
PWPTeam
Charlotte0.735GWU, Rich, XU
St. Louis0.726Day, Duq, XU
Dayton0.724Duq, SLU, XU
Saint Joseph's0.670Mass, Rich, TU
Fordham0.612URI, Bonas, TU
La Salle0.582GWU, Mass, TU
Duquesne0.475Day, Bonas, SLU
St. Bonaventure0.453Duq, Ford, URI
George Washington0.438Char, LSU, Rich
Xavier0.380Char, Day, SLU
Massachusetts0.353LSU, URI, SJU
Rhode Island0.308Ford, Mass, Bonas
Richmond0.305Char, GWU, SJU
Temple0.208Ford, LSU, SJU
Avg.0.498
Std. Dev..0.171

"Protecting" a rival clearly still holds for the coming season, as Xavier and Dayton will renew their in state rivalry, Temple will face both Big 5 rivals (La Salle and Saint Joseph's), while Massachusetts and Rhode Island will extend their regional (New England) rivalry with another home & away series this season. Travel appears to have played a role as well, as Charlotte, Richmond and George Washington have all managed another season with mirror games. Television match-ups, Xavier/Dayton aside, appears to be a minor consideration. Looking at the average of the PWPs, it may seem the schedule maker created a "balanced" set of mirrors conference-wide, the standard deviation (and a visual inspection of the list highest to lowest) would strongly suggest otherwise.

Notes & Observations
A blend of regional rivals may help Charlotte's travel budget, but George Washington was stronger than anticipated last season, and with new coach Mike Lonergan at the helm in place of the departed Karl Hobbs combined with the return of well regarded (but red shirted last season) Lasan Kromah, the Colonials should be an even tougher challange in 2012. The Spiders lost Kevin Anderson and Justin Harper (and Dan Geriot), but Coach Chris Mooney has a deep squad at Richmond, which suggests the 49ers will again post a losing record in these six games.

Duquesne and Xavier account for Dayton's high PWP average for 2011, but Coach Rick Majerus returns over 90% of the minutes from the Bills' 2011 squad, and also bring back suspended Kwamain Mitchell, an All-Conference player in 2010. If Duquesne can regain their early 2011 momentum, Dayton may be hard pressed to come away from that six game set with even one win.
Xavier's mirrors seem to be a good balance of rivals and travel, but Saint Louis may be a tougher opponent this time around.

St. Bonaventure may benefit from a down year at Rhode Island and continued slow progress at Fordham. Like Xavier, the Bonnies appear to have drawn a traditional rivals schedule (Fordham and Duquesne) with travel (Rhode Island) as a consideration too. Coach Schmidt's squad went 4-2 against those three in 2011, and, given the 25% returning minutes at Kingston in 2012, may do even better in 2012.

Massachusetts, like St. Bonaventure, earned a 4-2 record against their mirror opponents in 2011, but if Saint Joseph's, the beneficiary of a an above average percentage of returning minutes (69%), improves as anticipated, Coach Derek Kellogg may be pressed to repeat that record in 2012. For a coach already feeling a bit of heat, that may well be the tipping point in his tenure.

Coach Jim Baron will see only 24% of his 2011 minutes return for 2012, so even with a rather light set of mirror opponents, the Runnin' Rams may take a step back from their 2011 3-3 mirror record.

Temple's 6-0 mirror record last season was due, in large measure, to the weakness of their three opponents who managed a collective 11-37 record in conference play last season. Collectively Fordham, La Salle and Saint Joseph's will absolutely improve their record next season, but expect Coach Fran Dunphy's squad to post another 6-0 record versus those three. That is a huge advantage when putting together a conference record.

Wednesday, May 25, 2011

On Second Thought -- Plotting Trendlines for Atlantic 10 Teams (pt 2)


Badly Timed Slumps...
After developing the trendlines for all 14 teams of the Atlantic 10 Conference, two trends were obvious (a characteristic shared in common it would seem, with all conferences) -- those teams for whom the adjusted offensive efficiency trendline plotted above the adjusted defensive efficiency trendline, and remained there for the entire conference regular season, and those teams for whom the adjusted defensive efficiency trendline plotted above the adjusted offensive efficiency trendline and remained there throughout conference play. The former generally (but not always) finished at the bottom of the conference. The latter tended to dominate in conference play, finishing at the top of the conference. Those two trends however, account for about half the teams in the A10 (and seven of 16 teams in the Big East), but what of the others? Among the other seven Atlantic 10 teams two trends predominated -- either the offense declined as the conference season wore on, to the point that the defensive trendline crossed over or the offensive efficiency trendline rose through the latter part of the season (at least...). The first trend suggests the team was falling into a late season slump. The second trend, the team's offensive efficiency improved as the season progressed, suggests the players were "getting it" offensively (or the staff had begun to identify -- and play -- those players who were "getting it" offensively), but may have struggled with defense. The defensive efficiency trendline may (or may not) have crossed over the offensive trendline, but for three of those four teams (those three will be the subject of the next "On Second Thought..." post), the offensive efficiency trendline was above the defensive efficiency trendline by the end of conference play. This post will look at the four teams whose defensive efficiency trendlines were above their offensive efficiency trendlines by the end of conference play. The conference standings/seeds for the Atlantic 10 Tournament with the featured teams highlighted:

WLPct.
Xavier1510.938
Temple1420.875
Richmond1330.813
Duquesne1060.625
George Washington1060.625
Rhode Island970.563
St. Bonaventure880.500
Dayton790.438
Massachusetts790.438
La Salle6100.375
St. Louis6100.375
Saint Joseph's4120.250
Charlotte2140.125
Fordham1150.063

As the trendlines below illustrate, by season's end the defensive efficiency trendline had definitely crossed the offensive efficiency trendline for all four teams.

Dayton


The trendlines shadowed each other during the entire conference season

As suggested by the trendlines, the Flyers maintained a 0.500 record through most of conference play. If the dropped a (surprise) road game to Duquesne early in the season, they broke back later against the Dukes. They collapsed in the last three conference games however, sliding from a 7-6 record to finish 7-9. Despite a conference tournament mini-run, the Flyers' credentials qualified them for the NIT only. The defending champions from 2010, the Flyers went out in the first round, 94-84, to the College of Charleston. Coach Brian Gregory accepted the Georgia Tech coaching job in April.

Duquesne


A soft early schedule caught up with the Dukes?

Through much of the out of conference schedule, the Dukes racked up the kind of efficiency margins that drew the notice of notable stat geeks, an unimpressive schedule accepted. Through the first half of conference play, the preseason raves seemed justified, but as the Dukes' offensive trendline hints, there was trouble ahead. Though their 19 point win over Fordham (91-72) looks like their high water mark offensively, Coach Ron Everhart's squad did record an impressive 25 point win (84-59) over George Washington. But a corner had been turned, as Duquesne's offensive efficiency trended down through the last 10 games of the conference season. Though they hung on to qualify for a bye seed in Atlantic City, the Dukes were eliminated in an overtime quarter final game by Saint Joseph's. Duquesne was eliminated in the quarter final round of the CBI Tournament, 77-75, by Oregon of the Pac-10 Conference.

Rhode Island


Another end of season slump?

The "book" on Rhode Island in the Coach Baron Era is the team starts strong and fades by season end. The Runnin' Rams played a very competitive 83-75 game against Pittsburgh (in Pittsburgh) to open the season, and (despite several subsequent headscratching losses in their out of conference schedule), opened the conference season with a 5-3 record. Through the first eight games Rhode Island's offensive efficiency improved by 9 points (per 100 possessions). Though the offensive efficiency trendline continued to mark improvement, the rate slowed to approximately two points (per 100 possessions). Meanwhile, the defensive efficiency trendline slipped upward, putting the team "under water" in their last three games of the regular season (actually a 1-2 record). The Runnin' Rams recorded a 4-4 record over the last half of their conference slate to drop into a first round game to qualify for Atlantic City. Coach Baron's squad was invited to the CBI Tournament where they were eliminated 66-54 in the quarter final round by Central Florida of CUSA.

St. Bonaventure


Note the consistent improvement in offensive efficiency

Most Bonnies fans would not think of the 2011 season as a bust. The team had it's strongest showing since 2001-02, logging a >0.500 record with an 8-8 finish in the Atlantic 10. Coach Mark Schmidt's squad finished in the A10's upper division, a feat not accomplished since the 2001-02 season. Schmidt has matched or bettered the Bonnies win total each season he has directed the team, and with the CBI bid, this is the first post season for St. Bonaventure since their 2001-02 bid to the NIT. St. Bonaventure had two characteristics different from the other three teams...

1. The Bonnies' offensive efficiency improved throughout the 2011 conference season. The initial point (around 95) may seem low, but the Bonnies gradually improved that efficiency through the season, finishing at around 115, a versy strong finish.
2. The defense undermined the Bonnies' offensive progress, though that too was trending in the "right" direction by season's end.

The trendlines do not, however serve as a good predictor to St. Bonaventure's post season prospects. The Bonnies dropped their last two games of the season, an upset to La Salle allowed the Explorers to swipe their ticket to Atlantic City, and a first round loss to Central Florida knocked them out of the CBI. In all however, a season to build on for next year.

Monday, January 31, 2011

Guest Contributor Ray Floriani: St. Bonaventure at Fordham

by Ray Floriani
BRONX, NY- St. Bonaventure bounced back from a tough home loss to UMASS on Wednesday, defeating Fordham 69-60 at Rose Hill on Saturday.


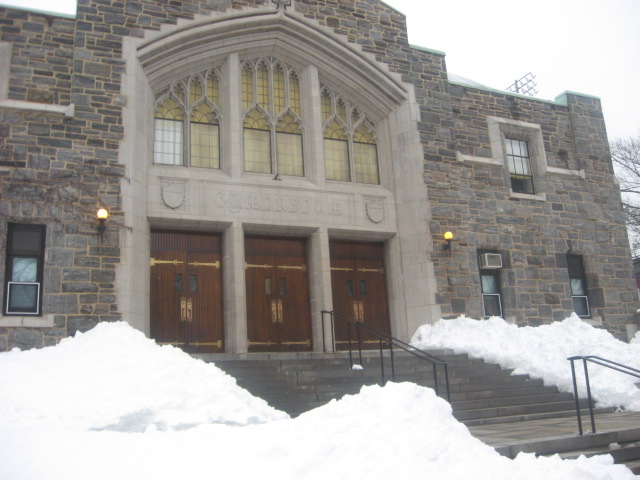
Outside Rose Hill Gym
Enough with the snow but at least its photogenic


The pace and efficiency:

 Off.
Poss.Eff.
St. Bona67103
Fordham6790


The Four Factors:

FTA
eFG%FGAOR%TO%
St. Bona46552412
Fordham3873512


Inside Rose Hill Gym


Free Throw Rate.
The Bonnies were 26 of 41 from the line while Fordham was 5 of 9. Rams coach Tom Pecora had nothing but praise for the officials. On the disparity from the stripe he said, "they (Bonaventure) came out aggressive. When you come out like that you put yourself in a position to get calls and get to the line. Give them credit. We came out too passive."

Mark Schmidt of Bonaventure added, "we get to the line a lot in our games. Our philosophy is inside/out. We get the ball inside and as a result get opportunities to go to the free throw line."

Fordham led 17-8 in offensive rebounds. A strong second half showing on the glass was responsible for the edge in the OREB percentage category.

TO rate was a revelation for the Bonnies especially. They had been plagued with turnover problems in recent seasons. On the season both clubs have a 21% TO rate. And in this contest they showed outstanding TO rate numbers.


Forward/Center Andrew Nicholson shows his form


Crucial Four
The first four minutes of both halves are critical to setting a tone. Fordham, down 36-20 at intermission, utilized those opening minutes to their distinct advantage. On Bonaventure's opening possession Andrew Nicholson was fouled in the act of shooting. Nicholson missed both free throws. Fordham scored on their first three possessions of the half. The Bonnies missed shots on the two possessions following Nicholson's misses from the line. Instead of a potential 18 point Bonaventure margin, the Ram deficit was 10 points with about 17 minutes to play in front of an energized home crowd. Fordham closed the four minute stretch with a 9-2 scoring edge in 6 possessions. The efficiencies for that juncture were Fordham 150 and Bonaventure 33. More important, a lead that took the Bonnies about a half to build was virtually sliced in half in the span of just four minutes.

Defending the Three
Taking a cue from David Hess' Project Scoresheet on the Audacity of Hoops site, I decided to chart every field goal attempt from three point range. For uncontested attempts, a notation was made. The results:

1st Half3 Point Shooting
OverallUncontested
St. Bona3-4 (75%)2-2 (100%)
Fordham3-11 (27%)0-2 (0%)


2nd Half3 Point Shooting
OverallUncontested
St. Bona2-7 (29%)2-5 (40%)
Fordham2-11 (18%)2-6 (33%)

For the game, the numbers were:

Game3 Point Shooting
OverallUncontested
St. Bona5-11 (46%)4-7 (57%)
Fordham5-22 (23%)2-8 (25%)

Seven of the 11 three point attempts by the Bonnies were uncontested. That was largely due to the inside game and the attention afforded Nicholson by the Fordham defense. The Rams just did not close out quicker on perimeter shooters. Also, the likes of freshman Matthew Wright (9 points on 3 of 5 beyond the arc) shot some very deep threes.

On the Fordham side, the Bonnies did a good job ensuring the Rams got a minimum of open, uncontested looks. They did get 6 uncontested looks the second half. Chalk that up to a few Fordham attempts in transition and with Chris Gaston more effective in the paint the final twenty minutes, the perimeter opened up a bit.

Numbers
St. Bonaventure is 11-9 (3-4 A-10). The Rams drop to 6-13 (0-7). Andrew Nicholson led all scorers with 25 points. The Bonaventure junior added 11 boards. Brenton Butler paced Fordham with 15 points while Chris Gaston led the Rams with 11 rebounds. Game was a sellout at Rose Hill. Gaston finished with 11 points and was well defended especially the second half. Fordham did own a 30-24 points in the paint edge. That was largely due to the second half and not just on posting up. The Rams were successful those final 20 minutes in hitting the offensive boards and getting dribble penetration. Demetrius Conger, a sophomore forward, finished with 11 points 5 rebounds and made a few big plays to allow the Bonnies to maintain the lead when Fordham made its second half run. Attendance was a sold out 3,200.


Bonaventure coach Mark Schmidt meets the media

Wednesday, March 17, 2010

Guest Contributor Ray Floriani: Quarterfinals at the A10

by Ray Floriani

ATLANTIC CITY, NJ- Go with the favorites , The Atlantic Ten quarterfinals at Boardwalk Hall in Atlantic City saw three of the higher seeds move on to the semis. Fifth seed Rhode Island provided the only upset, a mild one, in the day/night action.


Quarterfinal Scores
TeamScore TeamScore
Temple69
St.Bonaventure51
Rhode Island63
St.Louis47
Xavier78
Dayton73
Richmond77
UMass72

The game of the day was the 6:30 matchup between Dayton and Xavier. Two rivals in the conference post season tournament with Dayton fighting for it’s NCAA hopes, gave the potential for an intense ballgame. The pre-game buildup did not disappoint.

In a 75 possession game, the four factors:


FTM
ORtgeFG%FGAOR%TO%
Dayton9752322624
Xavier10445664124

Right from the tap this was a virtually frantic pace. Transition, three pointers, attacking the basket, physical play were the norm. Not a whole lot of half court sets , especially in the opening half. Dayton had a fifteen point lead with just under 12 minute to play. The Flyers could not hold off late charging Xavier , especially Terrell Holloway (22 points) and Jordan Crawford (20 points).

Offensive rebounding percentage told a significant story. In planning for this quarterfinal, Xavier coach Chris Mack emphasized rebounding as the priority. The Musketeers got the job done in resounding fashion.

The disparity in free throw rate can be attributed in part to Dayton’s late game fouling when they trailed and needed to get the ball back. A closer look can attribute part of that FT Rate advantage to the job Xavier did on the offensive glass. Second shots very often give better scoring opportunities and make the defense more susceptible to fouling. For the game Xavier shot better than Dayton from two point range. Xavier was 18 of 35 (51%) to Dayton’s 16 of 34 (47%). Again, offensive rebounding was a contributing factor.


Xavier's tempo-free grad assistants


Notes on the other contests. Richmond-UMass was a 71 possession game more to UMass’ liking. Richmond prevailed because they knocked down 11 treys (11-20) for a nice, 52% eFG percentage.

St. Louis had their 54 possession tempo, but Rhode Island did a great job on the defensive end. They forced the normally careful Billikens into a 24% Turnover rate and also enjoyed a marked 47-25 Offensive Rebounding percentage advantage.

Temple established a 56 possession tempo an was impressive in both phases of their offense. The Owls offensive efficiency was 127, the highest of any team in the quarterfinals, as Fran Dunphy’s club knocked down six treys and shot 60% (24 of 40) inside the arc.

Xavier is tempo free. Our press row seat behind the bench gave great close up insight. For the Dayton-Xavier game we were behind the Xavier bench. After each time out an assistant asked a quick question , of two young men seated behind us keeping charts, such as ‘how many post touches the last four minutes?’ Near the end of one time out I asked the two men if they were coaches. Turns out they are grad assistants and the one said, “we are breaking down offensive efficiency.” Naturally yours truly said it was thrilling to hear that. The legions of tempo free followers is growing.

“(Jordan) Crawford and (Terrell) Holloway made the plays we needed in the stretch.” - Xavier coach Chris Mack

“For 32 or so minutes we played pretty darn good. When we needed the key stops we didn’t get them.” - Dayton coach Brian Gregory.

Officials (Joe DeMayo center) confer
with coaches Brian Gregory of Dayton (L) and Xavier's Chris Mack (R) over a ruling

Friday, February 26, 2010

Guest Contributor Ray Floriani: St. Bonaventure at Fordham

by Ray Floriani

BRONX, NY- In a game that saw 13 ties and a dozen lead changes, St.Bonaventure edged Fordham 73-68 at Rose Hill.

In a 71possession (St. Bona 73 Fordham 69) game, the Efficiency and Factors:


FTM

ORtgeFG%FGAOR%TO%
St. Bona10048273316
Fordham9943332816

Bonaventure has cut down on the turnover nemesis which has been a problem the past few seasons. Bonnies are under 20% in A-10 play in turnover rate and took care of the ball well.

Rebounding and defense, per coach Mark Schmidt, were the keys to the Bona victory. In raw numbers Bonaventure enjoyed a 41-35 edge on the glass and Fordham shot 37% for the contest.

Bonnies had a 44-26 edge on scoring in the paint and a 17-6 margin in second chance points.

Significant. Andrew Nicholson, the Bonnies sophomore center and inside threat, scored five points and fouled out after logging 22 minutes. Nicholson was not feeling well but gave it a go. As Schmidt also noted it’s significant to get a road win when a player of Nicholson’s stature is not a big factor.

Jon Hall led all scorers with a 24 point night. The Bonaventure guard also added 8 boards.

Chris Gaston of Fordham posted 18 points and 13 rebounds. Gaston did commit 5 turnovers which can be somewhat excused to having defenders double down on him on the blocks and the fact he had to log the full 40 minutes.

Brenton Butler led Fordham with 20 points but was 5 of 15 ( 2 of 7 from three) from the floor.

Lance Brown was out for Fordham but Herb Tanner filled in at guard scoring nine points. His trey at the first half Buzzer gave the Rams a 35-34 lead.

Bonnies limited Fordham to 14 of 36 shooting (39%) from two point range. On the offensive end Bonaventure shot 52% from two point range (27 of 52) and wisely attempted only seven treys while hitting one. Bonnies struggled at the line going 16 of 30.

Always impressed with the hustle of freshman forward Fahro Alihodzic of Fordham. There are nights, as tonight, though he is not a big factor. Alihodzic scored 4 points with 3 rebounds in 22 minutes.

Living with prosperity. Something Bonaventure had had trouble with especially away from home, having dropped heartbreakers at Duquesne and St.Louis earlier. Bonaventure led by seven with 90 seconds to play and proceeded to shoot 2 of 7 from the line. On the other end the Rams could get no closer than a four point deficit.

Elerby. The ‘Bonaventure Bandwagon’ - the fan’s chat room has been extremely critical of junior guard Malcolm Elerby. Granted he hasn’t had a consistently solid year but at Rose Hill his play was good. He scored 10 points (4 of 8 from the line was not great), added 5 assists and made some nice defensive plays. Watching him, I saw a lot of good things as noted. All of a sudden he passes on the wing and sends the ball almost onto Arthur Avenue. You can hear the Bandwagon group let out a collective groan. Elerby must have a friend on the stat crew as he was listed for zero turnovers.

Records. Bonnies are 12-14 (5-8 in A-10). Fordham is 2-24 (0-14).

“I didn’t expect us to pull away . Fordham plays very hard and will never quit. I thought (Jon) Hall was they key for us tonight.“ - St. Bonaventure coach Mark Schmidt

“We got hammered at URI but responded with two great practices. Tonight we didn’t get the loose balls, block out at times and make the plays we needed in the stretch.“ - Fordham interim coach Jared Grasso
St. Bonaventure Coach Mark Schmidt

Tuesday, February 3, 2009

Guest Contributor Ray Floriani: Forced & Unforced Turnovers

by Ray Foriani

SOUTH ORANGE, NJ - Happy Ground Hog Day! Hard to believe it is a little over a month until the Big East Tournament in New York. At any rate…The late Al McGuire coined the phrase ‘more turnovers than Betty Crocker’. That came to mind reading that St.Bonaventure had 31 TOs in Saturday’s 74-68 loss at Duquesne. The numbers

PossEffTO Rate
St. Bona848131.0%
Duquesne819112.3%


A 91 defensive efficiency usually gets a W. But when almost 70 percent of your possessions end in handing the ball over, It’s tough to win. To add insult to injury, as bad as Bonaventure was with the basketball, Duquesne, on the other hand, valued it.

There is also a concept quoted on the Kentucky Sea of Blue site. It deals with forced(direct) and unforced(indirect) turnover. A steal is a forced turnover, the ball is clearly swiped and possession changes. The unforced variety includes throwing the ball away without pressure, stepping on the end line etc. Now, good defense can force you to step on the line or make a hurried pass that goes into the first row. Statistically, the forced turnover percentage is not perfect but it gives a good idea whose fault these miscues were. To calculate forced turnovers divide steals by turnovers. Duquesne had 8 steals. That figure divided by the Bonnies’ total (31) means Mark Schmidt’s club was guilty of 74% unforced turnovers.

The Sea of Blue site deals with percentage of steals, simply what percentage of possessions end in steals. For the Bonnies their number was 9.5% . Haven’t used the forced/unforced concept too much so ascertaining good, bad and average numbers is still uncertain. One thing is certain, if your TO rate is 31% and over 70 % are your own fault, the offense is in critical condition.

Monday, December 8, 2008

Guest Contributor: Ray Floriani on Turnover Rates

SOUTH ORANGE, NJ -- A few stats jumped off the pages from this weekend. First, you suffer through a 31% turnover rate. And win! At the Seton Hall Women’s game on Saturday, the Hall did just that. Actually for a half it was even worse. The breakdown.

1st HalfScorePossEffTOTO Rate
Marshall333789822
Seton Hall3040751640


* I do not see every box score in America but still can’t remember a 40% TO RATE. For a game or a half.

GameScorePossEffTOTO Rate
Marshal5273712129
Seton Hall7374992331


For the second half Marshall had 19 points, 13 turnovers and a whopping 36% rate. Why the turn around, did the Hall go to pressure defense ? Quite opposite, Seton Hall coach Phyllis Mangina went from man to man to basic 2-3 zone and their opponents from Conference USA went into a 20 minute melt down.

Saw on Saturday night that Andrew Nicholson of St.Bonaventure blocked 8 shots in the Bonnies’ 60-53 win over Princeton. Realizing that Princeton will shoot a good deal beyond the arc, decided to figure the Bonnies’ block percentage.

Block percentage is blocks divided by two point attempts. Tigers attempted 27 two pointers. Bonnies had 10 team blocks which figures to an off the charts 37% block rate. On the night Nicholson added 16 points 9 boards to his personal ‘block party’.

PossEff
Princeton6384
St.Bona6198

Monday, November 24, 2008

Guest Post: Ray Floriani on St. Bonaventure - Rutgers Game

PISCATAWAY, NJ -- St.Bonaventure upset Rutgers 64-63 in the Garden State Classic on Sunday at the RAC and two stats stand out. During a pre-game courtside chat Rutgers assistant Darren Savino said that one of the priorities in facing St.Bonaventure was to limit turnovers. For the game Rutgers had 15 turnovers but a significant stat was 11 came the first half.

TO Rate1st HalfGame
St.Bonaventure21%17%
Rutgers36%21%


The 21% figure is just over the 20% suggested limit but not excessive. The 36% is another story. Those 11 first half turnovers were crucial as they prevented Rutgers from opening a lead. Rutgers led 24-23 at the half. After the game Bonnie coach Mark Schmidt noted the longer his team ‘hung around’ the more their confidence grew.

Another notable stat was offensive rebounding percentage

St.Bonaventure46%
Rutgers32%


That figure and difference for Bonaventure was huge, literally and figuratively. The Bonnies were expected to have trouble with the Scarlet Knight frontcourt but actually won the battle of the boards.

The Final numbers

PossessionsEfficiency
St.Bonaventure6993
Rutgers7288